Brexit / EU Referendum: UK immigration figures 2016
This post is an attempt to cut through the rhetoric and vitriol concerning UK immigration and the upcoming Brexit/EU referendum.
Using data from the ONS quarterly migration report I have extracted just the actual figures for you to use as you see fit.
This is a 'best effort' undertaking and I may have made mistakes - notify me in the comments.
Comments politicising this data will not be approved, save such things for your Facebook timelines or whatever.
Long Term International Migration to/from UK to year ending December 2015 for previous 12 months
An estimated current total population of UK = 64,596,000
An estimated total current non-British population = 2.1 million
Total foreign citizens by percentage = 3.25%
THE NUMBERS THAT CAME & LEFT
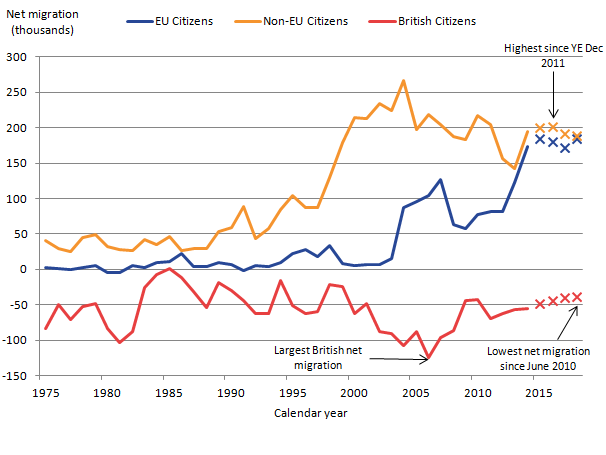
Net Long-Term International Migration by citizenship, UK, 1975 to 2015 (YE December 2015) ~ Source: Office for National Statistics, Long-Term International Migration
Immigration
Total figures - (combined)
Total immigration (came to UK) = 630,000
Total Emigration (left the UK) = 297,000
Net figures - EU vs non-EU
Net British immigration = -40,000
Net EU immigration (EU people who came here) = 184,000
Net non-EU migration = 188,000
Emigration
British nationals leaving UK = 123,000 (83,000 arrived but more left)
EU Citizens leaving UK = 85,000
Non-EU citizens leaving = 89,000
THE BOTTOM LINE
Total population of UK = 64,596,800
Total Net immigration = 297,000 (0.46% of total population)
Total loss of British citizens = 40,000 (0.06% of total population)
Total gain of EU citizens = 185,000 (0.27% of total population)
Total gain of non-EU citizens = 188,000 (0.29% of total population)
WHY THEY CAME
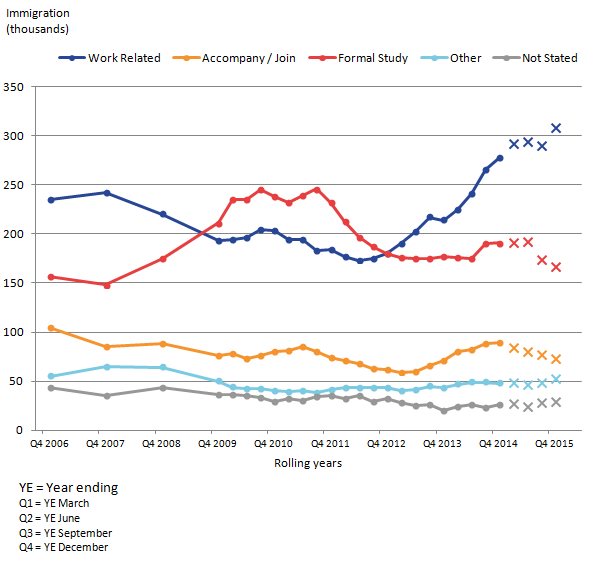
Long-Term International Migration estimates of immigration to the UK, by main reason for migration, 2006 to 2015 (YE December 2015) ~ Source: Office for National Statistics, Long-Term International Migration
Approx 75% of immigrants came here to work or to study. Of those 75%, IPS estimates show around 61% of immigrants arriving for work were EU citizens, 24% were non-EU citizens and 15% were British citizens (returning from overseas).
Figures (mixed EU and non-EU)
Arriving for work = 308,000 (178,000 from EU, 130,000 from non-EU)
- Those with definite job offer = 178,000 (101,000 EU, 77,000 non-EU)
- Those looking for work = 130,000 (77,000 EU, 53,000 non-EU)
Arriving to accompany/join = 73,000
Formal Study = 167,000
Other reasons = 52,000
- Asylum applications = 41,563 (largest aprt of that 52,000 total)
Not stated = 29,000
CAVEATS
Reading the whole report and understanding the methodology, restrictions and error margins means you cannot fully accept this data as 'perfect'. This is, however, the most respected, independent and officially researched of available data sources.
I encourage you to read the entirety of the report, if only because misery loves company and I had to so so do you.
SOURCE
The Office for National Statistics "Migration Statistics Quarterly Report: May 2016"
Text only version: Click to download.